A current month’s chargeback recovery rate can change because unresolved disputes have not yet entered its resolved-case denominator. As they close, their outcomes and values can raise or lower the rate. Review pending exposure, sample size, case mix and data completeness before deciding what a recent result means.
A provisional result is still useful. It can reveal work that needs attention or a concentration of losses. The important step is to distinguish those findings from a final judgment about the entire period.
What the Current Recovery Rate Actually Describes
A resolved-value recovery rate divides eligible won value by eligible won plus lost value. Cases still processing or under review are not automatically treated as losses. A case-count win rate applies the same principle to numbers of cases instead of dollars.
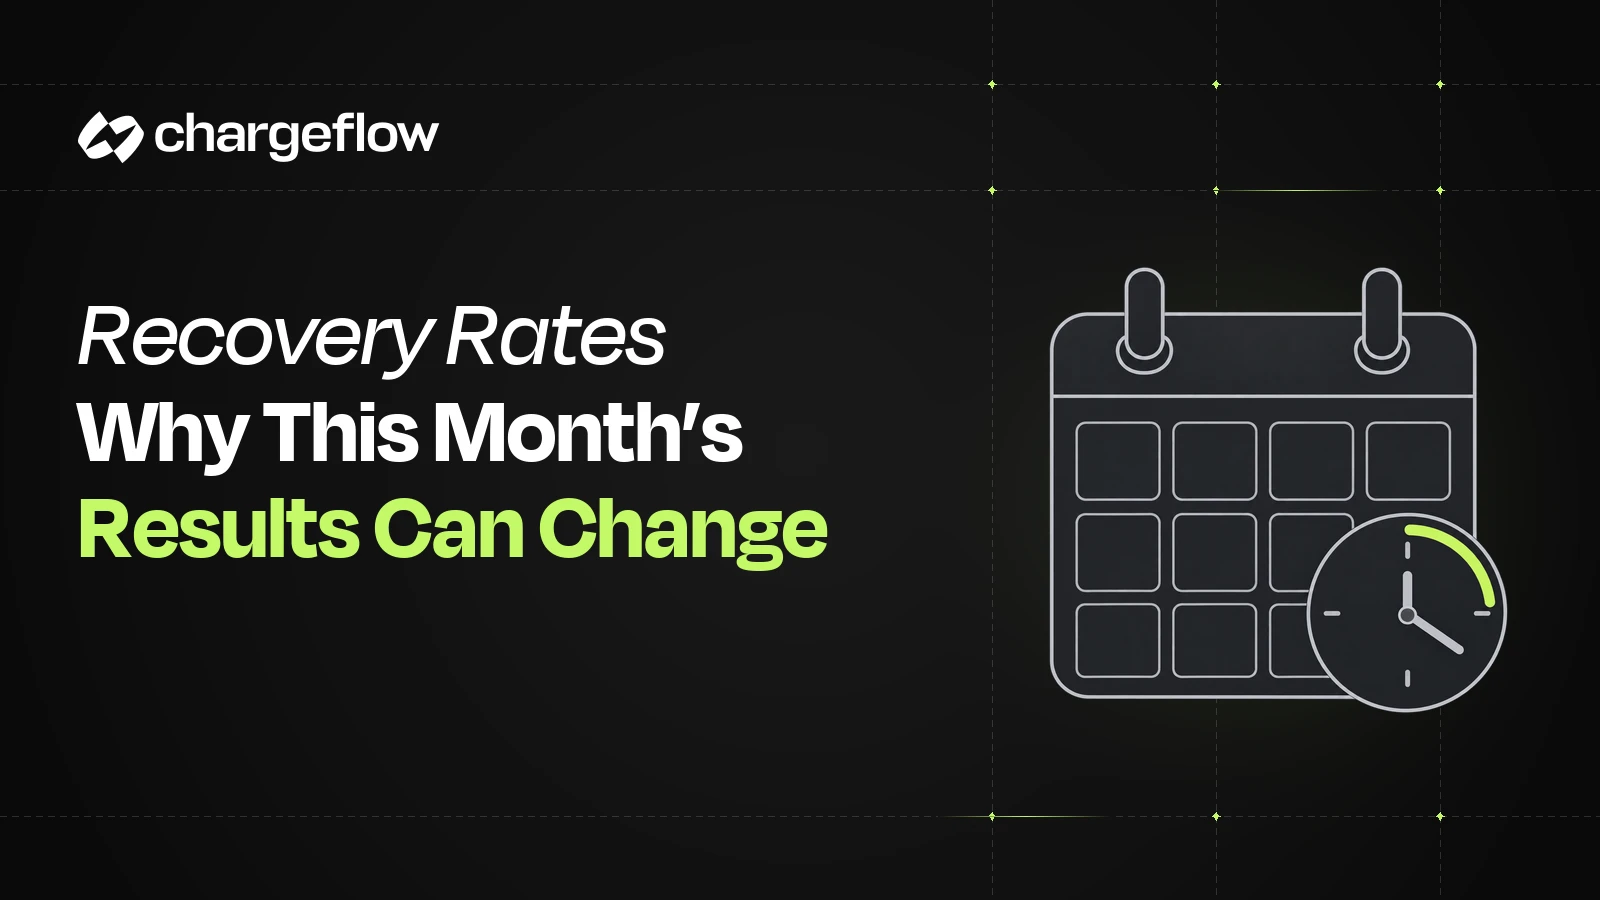
In Insights 2.0, a clock indicator in the recovery-performance table identifies a period whose result can still change as unresolved disputes receive outcomes. That is a reminder to inspect the cohort, not a prediction of its final result.
For Chargeflow-managed rates, lost disputes flagged as intentional fraud are excluded from the denominator. Keep that eligibility rule visible. It also means a product rate can differ from a separate internal calculation that includes every received dispute.
The Same Starting Rate Can End Higher or Lower
Hypothetical example: a fixed group of seven disputes uses USD throughout, has no eligibility exclusions and has no changes to disputed amounts. Five cases are resolved: three $100 wins and two $100 losses. Two cases remain under review, worth $400 and $100.
Current resolved-value rate: $300 ÷ ($300 + $200) = 60%.
Value still under review: $500.
Illustrative later outcome
Final eligible won / lost value
Final value recovery rate
Both pending cases win
$800 won / $200 lost
80%
Both pending cases lose
$300 won / $700 lost
30%
Both scenarios start at 60%. The table is an arithmetic illustration, not a probability forecast or a customer result. Actual reporting can involve partial amounts, classification changes, currency conversion and new data corrections that also need explanation.
Case-count results would tell a different story: the two scenarios finish at five wins out of seven cases or three wins out of seven. This is why a recent case win rate should be read with dollar recovery, not substituted for it.
Calculate What a Target Would Require From Pending Value
For the seven-case example above, current won value is $300, eligible lost value is $200 and pending value is $500. If all pending value resolves under the same eligibility rules, the eventual resolved denominator will be $1,000. Use that condition to test a target; do not treat it as a forecast.
Test a recovery-rate target with your pending value
Use one fixed cohort and the same eligibility rules throughout. Enter aggregate USD totals. Required fields are marked *.
Assumption: all entered pending value eventually becomes won or lost, with no new cases, exclusions, partial outcomes or currency changes. Individual case values may make an exact threshold unattainable.
Current resolved-value rate—
Conditional final-rate range—
Future won value needed for the target—
Share of pending value required—
Planning arithmetic, not a forecast. The result does not estimate winning probability, issuer timing or settlement cash. A zero resolved denominator is shown as unavailable.
The pending cases are $400 and $100. Winning only the $100 case would not reach the target; winning the $400 case would. The threshold is an arithmetic requirement, not a prediction that a partial $200 outcome is available.
Recalculate if amounts, membership or eligibility change. Never describe the target as guaranteed, and keep the actual pending cases and their response requirements visible.
Use a Five-Check Review Before Calling Performance Poor
Comprobar
What it can reveal
Next action
Unresolved count and value
How much of the cohort remains undecided, especially its largest cases
Separate response work from cases awaiting an issuer outcome.
Resolved sample
Whether a few cases account for most of the displayed result
Show raw counts and values; avoid an unsupported precision claim.
Won and lost case sizes
Why case win rate and value recovery diverge
Inspect large lost or pending cases rather than only the average.
Reason and processor mix
A changed business or dispute population
Compare genuinely similar segments where enough data exists.
Source-record agreement
Missing updates, wrong scope or a reporting issue
Trace sample cases and escalate unexplained differences.
Run the checks in context. A large under-review balance may explain why a period is incomplete, but it does not excuse response failures, weak evidence or a genuine change in outcomes. A low rate with little pending exposure deserves a different investigation from a low rate with most disputed value still open.
Keep the Cohort Stable While You Observe It
A creation-date cohort follows disputes opened during a selected interval. An activity report can instead show decisions or submissions that happened during that interval, including older disputes. Mixing those views makes a month look as if its cases changed when the reporting question changed.
For a follow-up, save the account scope, creation interval, reporting cutoff, currency method and eligibility rule. Track the same group of cases as their status changes. Record data corrections separately so a backfilled record is not mistaken for a new operating result.
Recalculate the total rate from aggregate eligible won and lost value. Do not average a small month’s percentage with a large month’s percentage and call the result a portfolio rate.
Do Not Let a High Early Rate Hide the Open Exposure
A merchant can initially win all of a small resolved subset while most disputed dollars remain open. Calling that a settled performance result would overstate what is known. Show the proportion of the cohort that has resolved, both by count and by value.
Likewise, do not assign one universal maturity date to every business. Case stage, processor, available history and changing business conditions affect interpretation. A reasonable review can acknowledge uncertainty while still checking whether submissions, ownership and case records are working.
What to Tell Finance and Operations
A useful update states the observed rate, the eligible resolved amount, the pending amount and the investigation underway. For the hypothetical cohort above, that could be: “The resolved-value recovery rate is 60% on $500 of decided cases. Another $500 remains under review. We will update the result as those cases close.”
Keep a forecast separate. The recovery forecasting guide uses explicitly labeled scenarios; it does not turn the current rate into a promise about pending cases.
Reading This in Chargeflow Insights
Use the recovery funnel for processing, under-review, won and lost exposure, then inspect the performance table over time. In the table, distinguish Revenue Recovery Rate from Win Rate and read each period’s unresolved indicator with its underlying totals.
Check the individual widget scope before combining numbers. A global historical-cohort switch does not change every widget, and a section date control does not define all the other views. If records appear missing or inconsistent after those checks, treat the issue as a data investigation rather than an explanation about cohort maturity.
Preguntas frecuentes
Is the current recovery rate a minimum that will improve?
No. A resolved-case rate can rise or fall as pending disputes resolve. The current result is provisional, not necessarily a lower bound.
Should I count under-review cases as losses?
No. Keep unresolved cases separate unless a specifically labeled planning scenario assumes an outcome. Do not turn that scenario into the reported final result.
How many resolved cases make a rate reliable?
There is no universal threshold for every merchant and decision. Inspect counts, values, concentration and case mix, and show uncertainty when the evidence is sparse.
Why is a recent month worse than an older month?
The recent cohort may be less resolved, but it may also contain different reasons, large losses or a data problem. Compare those factors before attributing the gap to timing.
Can we still review the service before outcomes mature?
Yes. Review coverage, submissions, response ownership, source accuracy and remaining manual work, while labeling the outcome assessment preliminary.



















 Más de 600 opiniones