











Comparing Disputes Across Processors Without Confusing Share With Risk


Chargebacks?
Não é mais problema seu.
Recover 4x more chargebacks and prevent up to 90% of incoming ones, powered by AI and a global network of 20,000+ merchants.


 Mais de 600 avaliações


Resumo:
- Dispute share, dispute rate and recovery rate answer three different questions; keep them in separate columns.
- Stripe's example: 10 disputes on 1,000 payments is 1.0% by dispute date but 0.3% by charge date.
- A processor can lose the overall ratio while winning every segment, because of case mix.
- Recompute portfolio recovery from total won and lost value; never average processor percentages.
- Without matching payment counts, report concentration only and say the rate was not assessed.
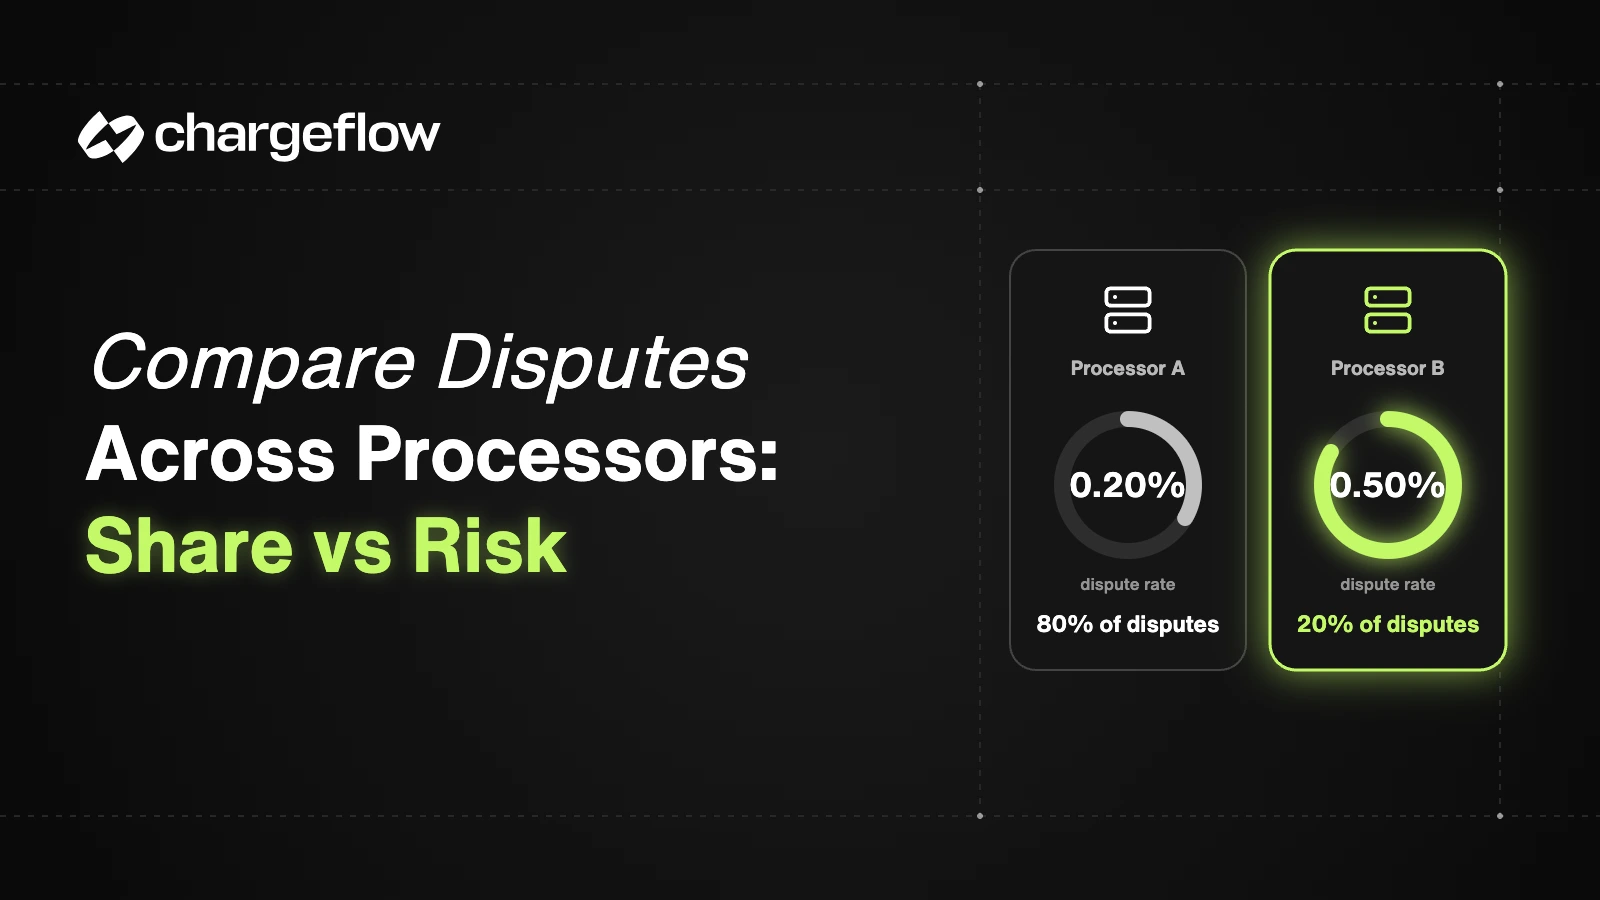
The processor with the most disputes is not always the one with the highest dispute rate. Dispute share shows where disputes concentrate. A processor-level rate also needs matching payment volume, account scope and date rules. Recovery is a third question: what happened to the disputes that were resolved.
These differences matter for merchants that use several payment providers or run several stores. A unified dashboard can show a pattern worth checking. A share chart alone cannot rank processor quality or justify rerouting payments.
{{cta}}
Which Question Are You Asking?
Pick the question first. Each one needs a different denominator.
Do not swap one calculation for another. A processor with a large disputed-dollar total may just have a higher average ticket, not more frequent disputes.
Does the Date Rule Change the Answer?
Yes, a lot. Stripe shows two numbers in its Dashboard. Dispute activity counts disputes by the date they arrive. Dispute rate counts disputes by the date of the original charge. Stripe's own example uses 1,000 payments in one week and 10 disputes received that week, of which only 3 came from that week's payments.
1.0% dispute activity: 10 disputes ÷ 1,000 payments | 0.3% dispute rate: 3 disputes ÷ 1,000 payments |
Source: Stripe Docs, Measuring disputes.
Card network monitoring programs use the activity view, and Stripe notes that activity above 0.75% is generally seen as excessive. The charge-date rate keeps changing for about 120 days as late disputes arrive. So when you compare two processors, use the same date rule for both. See the Visa VAMP program for how Visa counts its ratio.
Example: Two Processors, Three Different Stories
These numbers are invented. The ratio uses disputes and payments from the same reporting period. It is not a network monitoring formula.
Processor A has more disputes. Processor B has the higher ratio. Both have the same disputed value. None of this explains why.
To estimate how many disputes a payment cohort will eventually get, link disputes to their original payments and allow for reporting lag. Recent payments have not had time to draw disputes yet.
Are Both Processors Handling the Same Kind of Business?
Check how traffic is split before you blame a provider. One may take international orders, subscriptions or high-value products. Another may be newer. Run this check first:
- Accounts: which stores and merchant accounts each row includes, and any missing connection.
- Event type: card disputes kept apart from other payment claims, with statuses normalized.
- Date basis: dispute creation, original payment, decision or posting date.
- Volume: matching payment counts or value from the right source.
- Maturity: open cases shown before you compare recovery.
- Currency: conversion rules written down.
Chargeflow Insights converts values to USD at the ingestion-day rate. That works for operating comparisons but may differ from a processor's settlement rate, so finance should keep both records. For setup across providers, see how to normalize chargeback data across processors.
Check for a Ranking Reversal Caused by Case Mix
A processor can have the higher overall ratio even when it is lower inside every segment. In this hypothetical, Processor A wins both segments but loses the total, because it carries most of the high-risk business.
Weighting both segments equally gives 1.05% for A and 1.60% for B. That standardized figure is a diagnostic, not either provider's real ratio. It shows why mix matters; it does not prove a processor caused the disputes.
How Do You Compare Recovery Rates?
Recompute from totals. Never average the percentages.
The simple average of 90% and 10% is 50% in both rows, but the real combined rate in the second row is 18%. In the managed Insights rate, losses flagged as intentional fraud are excluded from the denominator, so do not compare it with a processor figure that counts every loss. See the win rate and recovery guide.
What Should You Do With the Result?
- Many open disputes on one processor: check account coverage and statuses.
- One reason concentrated on one processor: pull a billing or delivery sample. See chargeback reason analysis.
- A large settlement gap: send it to finance.
- Records split across accounts: see multi-processor chargeback recovery and multi-store chargeback reporting.
These are safer next steps than rerouting payments right away. If you manage disputes for independent merchants, that is a platform setup, not a merchant consolidating its own stores. For a Shopify-only view, see Shopify chargeback reports vs unified analytics.
Write the Processor Finding With Its Limits
A useful finding reads: "Processor B has a higher same-period dispute ratio in the accounts reviewed. Subscription share and payment timing differ, so payments and billing will review a matched sample before proposing a change."
If you have no sales denominators, say: "Processor A accounts for 80% of included disputes; the rate was not assessed." Chargeflow Insights shows processor dispute patterns in one view with each widget's scope visible. The With Chargeflow / Before Chargeflow switch changes the two headline metrics, not every breakdown.
{{cta}}
Perguntas frequentes
Is dispute share the same as a chargeback ratio?
No. Share divides one group's disputes by all included disputes. A ratio divides disputes by a separate payment count under specific rules.
Can disputed-dollar share identify the riskiest processor?
No. It shows where dispute dollars sit. Ticket size, traffic mix and payment volume must be checked first.
Can I average processor recovery rates?
No. Recompute from total won and eligible lost value. Averaging percentages distorts the result when volumes differ.
Why do processor and Insights dollar totals differ?
Check account coverage, dates, statuses, partial amounts, ingestion timing and currency conversion.
Which dispute rate does Stripe use for monitoring programs?
Stripe says card network monitoring programs use dispute activity: disputes by the date received, divided by payments in the same period.
Fontes
The processor tables are hypothetical examples, not customer results.
See Every Processor in One View
Use Chargeflow Insights to review dispute patterns across your processors with their scope visible. Free forever.

Chargebacks?
Não é mais problema seu.
Recupere 4 vezes mais chargebacks e PREVENÇÃO — até 90% dos e-mails recebidos —, com tecnologia de IA e uma rede global Rede de 20.000 Lojistas.