









US vs UK Enterprise Chargeback Trends: 2026 Survey Findings


Chargebacks?
No longer your problem.
Recover 4x more chargebacks and prevent up to 90% of incoming ones, powered by AI and a global network of 20,000+ merchants.


 600+ reviews


TL;DR:
- 78% of UK enterprises saw chargebacks rise over 18 months, against 59% in the US.
- 84% of US enterprises use AI in chargeback management, against 73% in the UK.
- 85% of US enterprises saw a December chargeback increase, against 61% in the UK.
- The size of the rise was similar in both countries, so the UK gap is about reach, not speed.
- The survey covered 80 US and 41 UK businesses with $100 million or more in GMV, so treat it as a signal, not a national average.
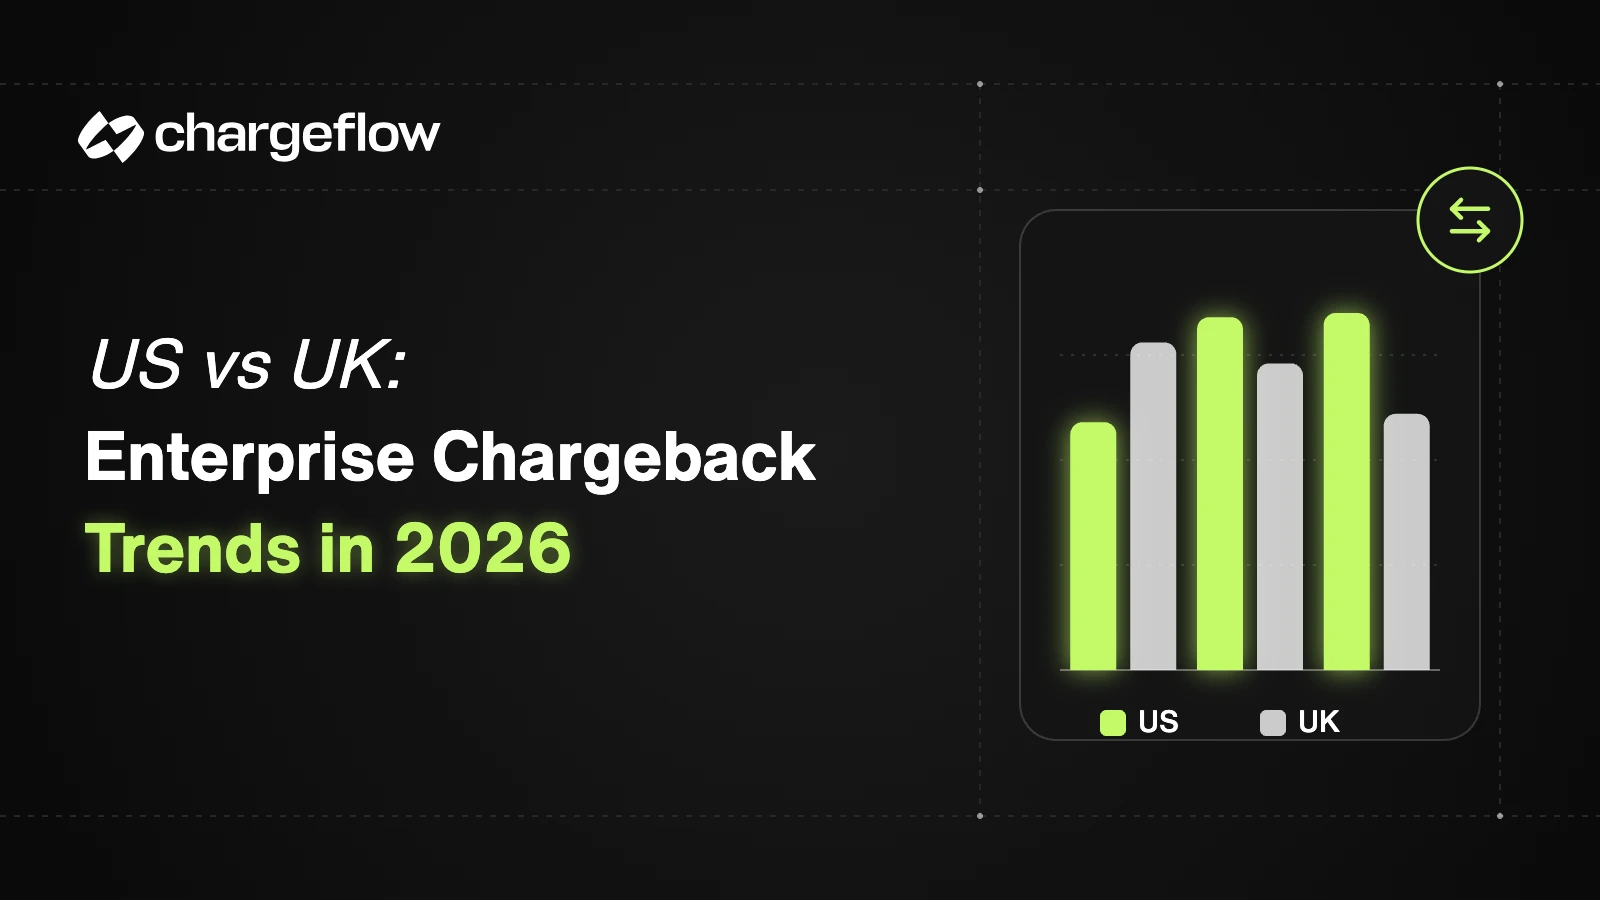
UK enterprises were more likely than US enterprises to see chargebacks rise in 2026: 78% against 59%. US enterprises were more likely to use AI and to see a December spike. These findings come from a Juniper Research and Chargeflow survey of 80 US and 41 UK businesses.
78% vs 59% UK vs US: chargebacks rose | 84% vs 73% US vs UK: use AI | 85% vs 61% US vs UK: December increase |
Source: Juniper Research and Chargeflow, The State of Chargeback Management, September 2026. US n=80, UK n=41.
{{cta}}
How Do US and UK Chargeback Trends Compare?
The two markets differ most on volume growth and holiday impact. They are close on how important holiday planning is.
Q10, Q22 and Q33 to Q35. US n=80, UK n=41, all n=121.
The full report has every chart, plus results on costs, win rates and buyer priorities.
Who Answered the Survey?
Juniper Research surveyed 121 C-level executives and senior managers in September 2026: 80 in the US and 41 in the UK. Every business had at least $100 million in yearly gross merchandise value, and 60% had $251 million or more.
Retail and consumer goods made up 49% of the sample, digital goods and services 33% and hospitality 8%. These are pooled figures. The country groups may differ in industry and business model, so read the gaps as signals, not national averages.
The UK group is also small. With 41 respondents, one answer moves a UK figure by about 2.4 points.
Are Chargebacks Rising Faster in the UK?
More UK enterprises reported a rise, but that is not the same as a faster growth rate. The survey asked whether volume rose, then how much. The size of the rise was consistent across both countries.
Figure 2, Q11, n=79 respondents whose chargebacks rose. The report notes this was consistent across countries.
So about nine in ten enterprises with rising chargebacks saw growth of 10% or more, in both markets. The UK difference is in how many businesses are affected, not in how sharply.
What Could Explain the UK Difference?
The survey does not test causes. Two UK rules shape which disputes reach a merchant, and both are worth checking against your own data:
Regulatory context, not survey findings.
The US has no SCA mandate, so 3D Secure use is a merchant choice. That changes the fraud and non-fraud mix you should expect by region. See 3D Secure 2.0 and the liability shift for what authentication does and does not cover.
Inside each company, teams may also read the same disputes differently. Risk leaders rank friendly fraud first and finance ranks it last, as shown in how finance and risk teams rank friendly fraud.
Do US Enterprises Use More AI for Chargebacks?
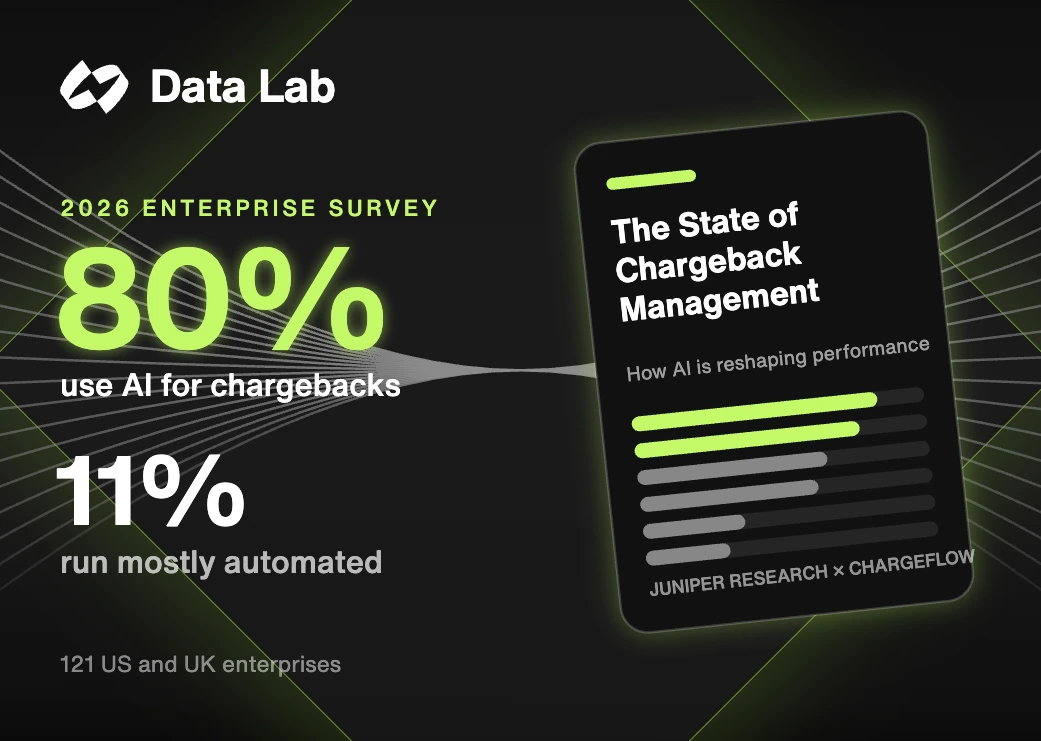
Yes. 84% of US enterprises use AI in chargeback management, against 73% in the UK. Most of the rest plan to start soon: 54% of non-users across both countries expect to adopt AI within 24 months.
AI use is not full automation. Across all 121 respondents, only 11% run mostly or fully automated processes. Read enterprise chargeback automation maturity for how to rate each step, and can AI improve chargeback win rates for the results side.
How Do Holiday Chargebacks Differ Between the US and UK?
US enterprises feel the holidays more. 85% saw chargebacks rise in December, against 61% in the UK. Across both countries, 77% see chargebacks rise over the December holidays.
A December spike is about volume. Whether the season will be better or worse is a separate question about losses. US respondents report both more December volume and more optimism about the season ahead.
Holiday disputes arrive late, often in January. See when Black Friday chargebacks arrive, the January peak data and the BFCM payments, fraud and disputes checklist.
Example: Holiday Capacity Calculation
Every input here is made up. The 25% rise is not a US or UK survey benchmark.
1,000 normal monthly cases | +250 holiday cases at a 25% rise | 83.3 h extra staff hours at 20 min each |
An enterprise handles 1,000 disputes a month and forecasts a 25% holiday rise. At 20 minutes per case, the extra 250 cases need about 83.3 more staff hours. Total handling grows from 333.3 to 416.7 hours, before repeat touches and escalations.
Swap in your own case count and handling time. If routine cases are automated, estimate only the exceptions left for staff. The cost and peak-capacity comparison covers the wider tradeoffs.
What Can This Comparison Not Tell You?
- It does not show that UK chargebacks grow faster, only that more UK businesses saw a rise.
- It does not separate country effects from industry, size or business model.
- It does not set a benchmark for smaller merchants, since every respondent had $100 million or more in GMV.
- Win-rate gains from AI are self-reported, not audited.
For wider market figures, see the chargeback statistics guide.
Plan Your Regional Chargeback Workflow With Chargeflow
Start from your own data by country: dispute reasons, authentication rates, December volume and handling time. Then decide where automation, chargeback alerts or extra staff fit. Review your enterprise chargeback workflow with Chargeflow to compare coverage across your processors and regions.
{{cta}}
Frequently Asked Questions
Are chargebacks rising faster in the UK than the US?
More UK enterprises reported a rise (78% vs 59% in the US). The size of the rise was consistent across both countries, so the survey does not show a faster growth rate.
Do US enterprises use more AI for chargeback management?
Yes. 84% of US respondents use AI in chargeback management, against 73% of UK respondents.
Do US merchants see more holiday chargebacks?
In the survey, 85% of US enterprises saw a December increase, against 61% in the UK.
Why might UK chargeback patterns differ from the US?
The survey does not test causes. Mandatory Strong Customer Authentication and Section 75 credit card protection both change which disputes reach UK merchants, so check your reason-code mix by country.
Can a small business use these figures as a benchmark?
Use them with care. Every respondent had at least $100 million in yearly GMV, so smaller merchants should compare against their own history first.
Sources and Survey Methodology
Findings come from The State of Chargeback Management: How AI Is Reshaping Performance, by Juniper Research with Chargeflow. Juniper Research surveyed 121 C-level executives and senior managers in September 2026: 80 in the US and 41 in the UK. All worked at businesses with at least $100 million in yearly gross merchandise value.
- Figure 1, Q10: change in chargeback volume, by country.
- Figure 2, Q11: size of rise.
- Figure 12, Q22: AI use, by country.
- Figure 22 and Table 23, Q33 to Q35: December increase, planning importance and season outlook, by country.
- Survey methodology: sample size, GMV and industry mix.
Regulatory context comes from the FCA and Which?. The capacity example and checklists are Chargeflow editorial guidance, not survey findings.
The State of Chargeback Management
Read the full Juniper Research survey of 121 enterprises: AI results, win rates, costs and what buyers expect.
Chargebacks?
No longer your problem.
Recover 4x more chargebacks and prevent up to 90% of incoming ones, powered by AI and a global network of 20,000 merchants.