








































How Much Should Shopify Chargeback Prevention Cost? A Per-Order ROI Model


Chargebacks?
No longer your problem.
Recover 4x more chargebacks and prevent up to 90% of incoming ones, powered by AI and a global network of 20,000 merchants.


 600+ reviews


TL;DR:
- Acceptable prevention cost per scanned order must remain below expected incremental loss avoided after intervention and false-positive cost.
- Pricing checked November 1, 2026: $0.10 per scan; the first 1,000 free scans are a one-time new-customer offer, subject to its stated terms.
- Net loss severity includes merchandise, fulfillment, shipping, fees and labor minus reliably recoverable amounts.
- A canceled order is not a confirmed prevented chargeback and should be probability-weighted in ROI modeling.
- Conservative, base and upside scenarios make uncertainty visible to Finance and Procurement.
- The correct comparison is incremental performance over the merchant’s current Shopify controls.
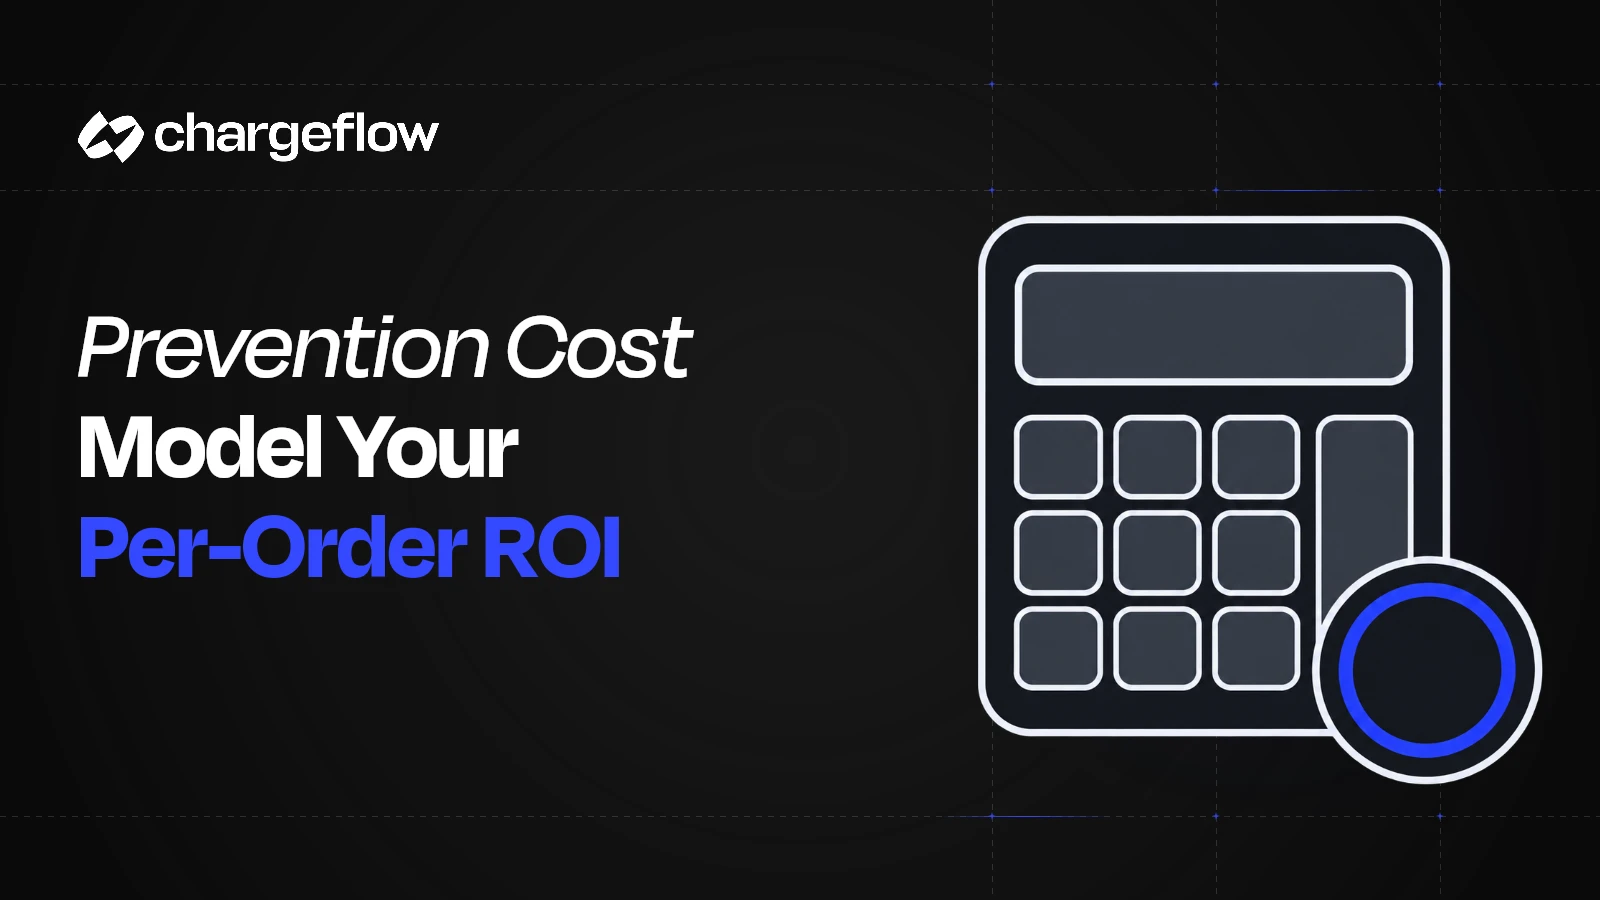
The acceptable cost per scanned order is lower than the expected incremental loss avoided per order after subtracting review, verification, fulfillment delay and false-positive cost. Use conservative, base and upside scenarios; never treat every canceled order as a confirmed saved chargeback.
Per-order pricing makes budgeting simple but can look expensive when disputes are rare. The correct denominator is the full eligible order population, while the benefit is the incremental risk reduction across that population.
Chargeflow’s pricing, checked November 1, 2026 states $0.10 per scanned transaction. Model the one-time introductory offer separately from ongoing cost.
Prevent workflow documentation, checked November 1, 2026 lists Proceed, On Hold and Cancel; automated Verify is marked coming soon. Confirm account availability and test that the hold reaches your fulfillment system. Other automations can override it.
Explore Chargeflow Prevent for ecommerce fraud and friendly-fraud prevention.
Tool cost
Eligible scans multiplied by current unit price
Known expense; confirm exclusions and billing definition.
Avoided loss
Risk probability × net loss × incremental prevention effect
Use calibrated ranges, not canceled-order face value.
Intervention cost
Review, verification, delay and CX work
Often omitted from simple ROI claims.
False-positive cost
Lost contribution and customer value from good-order friction
Required for balanced economics.
Downstream benefit
Reduced fees, alerts, evidence work and operational burden
Count only if incremental and not captured elsewhere.
Build the per-order equation
Incremental net value
Avoided net loss + separately counted downstream savings − scans − review − verification − delay − false-positive cost.
Per-order net value
Divide incremental net value by eligible scanned orders. Use the same time period and cohort for every term.
Break-even event count
Total incremental cost ÷ average net loss avoided per prevented event.
Break-even event rate
Break-even event count ÷ eligible scanned orders. This is an absolute rate reduction, not a relative percentage reduction.
Do not count a fee or support saving again if it is already included in the avoided net-loss estimate. Add implementation cost over an explicit evaluation period.
If the intervention and eligible order population are not yet defined, start with the pre-fulfillment prevention framework before estimating savings.
Use net loss, not disputed revenue
Include cost of goods, shipping, fees, labor and any unrecoverable service. Subtract reliably recoverable amounts and avoid counting the full sale as both revenue and merchandise loss.
For good orders canceled incorrectly, use lost contribution and a reasonable customer-value sensitivity, not the full lifetime value as certainty.
Model three scenarios
The conservative case should use low incremental detection, modest net loss and higher false-positive cost. The base case should use measured pilot inputs. The upside case can test stronger effect but should not become the budget default without evidence.
Keep volume, chargeback maturity and seasonal mix visible. A holiday pilot can overstate both risk and intervention cost.
Reconcile forecast to observed results
After launch, replace assumptions with scan count, action mix, verification, fulfillment, mature disputes and support time. Use comparable mature outcome cohorts to estimate incremental effect. Observation without enforcement can reveal disagreement and workload; it cannot by itself establish prevented loss.
Report cash impact and model uncertainty. Finance should approve scale only if the downside scenario remains acceptable or if strategic benefits are stated separately.
Worked example: per-order ROI
Every outcome below is hypothetical. Assume 50,000 eligible monthly scans at $0.10 = $5,000. Assume a mature baseline event rate of 0.6% and $180 average net loss per event: 50,000 × 0.006 × $180 = $54,000. Add $3,000 for review, verification, delay and good-order harm, making total incremental cost $8,000.
Scroll horizontally to see every column.
| Scenario | Assumed relative loss reduction | Avoided loss | Net benefit after $8,000 cost |
|---|---|---|---|
| Conservative | 10% | $5,400 | −$2,600 |
| Base | 20% | $10,800 | $2,800 |
| Upside | 30% | $16,200 | $8,200 |
These percentages are assumptions, not measured results or vendor promises. Holding cost and severity constant isolates sensitivity to effectiveness; also vary review cost and lost legitimate contribution in your own model.
Base-case net value: $0.056/order
$2,800 ÷ 50,000 eligible scanned orders. Benefit-cost ratio: $10,800 ÷ $8,000 = 1.35×. Net return on spend: 35%.
Break-even: about 45 events
$8,000 ÷ $180 = 44.44 incremental events per month; 45 whole events exceed cost. Model forecasts can use fractional expected counts.
Absolute reduction: 0.0889 percentage points
44.44 ÷ 50,000 = 0.0889% of eligible orders. The assumed event rate would move from 0.6% to about 0.5111%.
Relative reduction: about 14.8%
0.0889 ÷ 0.6 = 14.8%. Report the baseline and denominator whenever quoting a percentage improvement.
The example excludes a separate implementation charge and assumes the $3,000 covers all other incremental cost. Add any omitted cost before using the break-even result.
Use the billing mechanics, not only the headline price
Current pricing terms, checked November 1, 2026 specify $0.10 for each screened incoming sale or capture after completion, billed through Shopify App Usage Charges. New customers receive the first 1,000 scans free once; the offer is available through December 31, 2026 and the scans are valid for three months from activation. Confirm the terms in your account before purchase.
Do not subtract 1,000 free scans every month. Under the stated unit price, the full one-time allowance is worth $100 if used within its terms. Keep that temporary benefit outside the steady-state comparison.
Use the single-order decision framework for a fulfillment choice, the prevention KPI guide for measurement, and the lifecycle comparison to prevent attribution overlap.
Implementation sequence
- Define eligible volume: Count the orders that will actually be scanned.
- Confirm current price: Verify unit, promotion, taxes and billing treatment.
- Estimate net event loss: Include variable fulfillment and operating cost.
- Estimate incremental effect: Use pilot or matched evidence over the current stack.
- Add friction and labor: Price reviews, delay, support and lost good orders.
- Calculate break-even and scenarios: Show conservative, base and upside assumptions.
- Refresh with mature data: Replace forecast inputs after the pilot.
Failure modes and controls
Scroll horizontally to see every column.
| Failure mode | Business consequence | Control |
|---|---|---|
| Canceled value equals prevented loss | Benefit is overstated. | Probability-weight the counterfactual. |
| Dispute amount equals merchant loss | Margin and recoverability are distorted. | Use net loss severity. |
| Current price published without date | Commercial content becomes stale. | Date and reverify pricing and promotion. |
| Baseline controls ignored | Add-on receives credit for existing prevention. | Model incremental effect only. |
How Chargeflow Prevent fits
The published per-scan price supplies a concrete cost input. The value side must come from your own eligible volume, mature outcomes and customer impact. Use the 30-day pilot plan to collect operating inputs and schedule the later financial review.
Frequently asked questions
What is the break-even formula?
Total incremental prevention cost divided by net loss per prevented event gives the minimum incremental events prevented; divide again by eligible orders for a rate.
Should scan cost be divided by risky orders?
Budgeting can show both, but ROI should retain all eligible scans because every scanned order incurs the stated unit cost.
Can canceled order value be counted as savings?
Not as confirmed savings. Use a calibrated probability and net loss, then report a range.
What costs are usually missed?
Manual review, buyer support, fulfillment delay, false positives and integration maintenance.
How often should the model be refreshed?
After outcome maturity and whenever pricing, order mix, fulfillment economics or policy changes materially.
Do chargebacks cost merchants more than the disputed amount?
Often yes. Relevant cost can include lost merchandise, fulfillment, shipping, processor fees, analyst time, support and monitoring-program exposure, offset by amounts reliably recovered. Use the merchant’s actual net loss rather than a generic industry multiplier in the ROI model.
Sources
Model the Value of Prevention
Explore Prevent’s per-scan model and test incremental value against your current Shopify controls.
Chargebacks?
No longer your problem.
Recover 4x more chargebacks and prevent up to 90% of incoming ones, powered by AI and a global network of 20,000 merchants.