



















































High-Value Chargebacks: Find the Losses Hidden by a High Win Rate


Chargebacks?
No longer your problem.
Recover 4x more chargebacks and prevent up to 90% of incoming ones, powered by AI and a global network of 20,000+ merchants.


 600+ reviews


TL;DR:
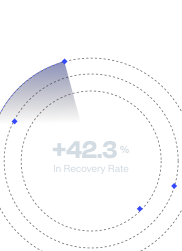
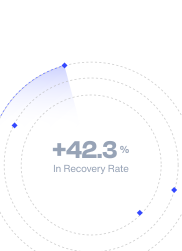
- Win rate counts cases; recovery rate weighs dollars. A 90% win rate can sit beside 26.47% dollar recovery.
- Rank losses by disputed value, then review the records before naming a cause.
- Run a sensitivity check on the largest loss, but keep the full result as the official rate.
- Track open high-value disputes separately; they are neither confirmed losses nor sure recoveries.
A high-value chargeback analysis checks whether a few large disputes cause most of your losses. A high win rate can hide poor dollar recovery when that happens. Compare the share of closed cases you won with the share of disputed dollars you recovered. Then review the largest lost and open cases.
This review helps merchants who sell expensive products, annual plans or a mix of small and large orders. It explains a result that looks wrong at first: more cases won, but less money back.
{{cta}}
Why Large Disputes Deserve Their Own Review
Each lost dispute costs more than the order. Mastercard research, citing Datos Insights, estimates an average merchant cost of $128 per chargeback. That covers $82 in internal costs and $46 in third-party fees. Global chargeback value is projected to grow from $36.9 billion in 2026 to $46.1 billion in 2029.
When a few disputes carry most of the value, one loss can outweigh dozens of small wins. Our guide to what happens when you lose a chargeback covers the money flow behind each case.
Compare Two Measures of the Same Closed Cases
Chargeflow's win rate and recovery rate definitions work like this. Win rate divides won cases by won plus eligible lost cases. Recovery rate uses the dollar values of the same cases. Both can be correct and still point in different directions.
This is an illustration, not a Chargeflow customer result. The lesson is concentration. Understand the ten large losses before you decide a 90% win rate means the money problem is solved. Our guide to chargeback win rate explains both formulas in more depth.
Apply the same eligibility and date rules to both measures. The managed Insights rate leaves out losses flagged as intentional fraud. The historical comparison keeps those losses. That gap can change how two periods compare. It does not mean every fraud-coded dispute is excluded.
Build a Loss-Concentration Worksheet
Use the dashboard to spot the gap. Then review case records through your dispute workflow. The worksheet below is a working tool. It does not mean Insights has a built-in high-value segment or an automatic concentration report.
Hypothetical lost value: $5,000 across ten cases
Two $1,500 orders · $3,000 · 60% of losses
Three $400 orders · $1,200 · 24% of losses
Five $160 orders · $800 · 16% of losses
Illustrative split of the same $5,000 total. The two largest losses merit early review because of their size, not because they are the easiest to recover.
For your own worksheet, keep these fields for each case:
- Case reference, disputed amount and currency
- Converted value, if you use one
- Status, reason, creation date and decision date
- The records needed to test a cause
- A review owner and one concrete question
Limit access to the customer data the review needs. Avoid writing "high risk" next to every large order.
Test Whether One Large Loss Dominates the Result
Run a sensitivity check next to the full result. Do not remove any real case from the official number. In the worksheet above, won value is $1,800 and lost value is $5,000, including one $1,500 loss.
Read the check correctly
The 7.49-point gap shows how much one case moves the rate. It does not make 33.96% the corrected result, justify an eligibility change or prove the loss was preventable. Keep 26.47% as the official rate and review that case's records first.
Separate Disputed Amount, Margin and Cash
A large dispute amount is not the same as a large lost margin. You may already have paid for product, shipping and handling. A refund, a partial chargeback or a processor adjustment can also change the result. Use the disputed amount in the source record, not the original order total.
Recovered Revenue in Insights shows the converted value of won disputes. It is an operating measure. Finance still needs processor postings and costs to confirm settled cash. Our guide to chargeback accounting covers how to book each outcome.
Keep three columns in the finance review: closed lost value, open disputed value and cash already posted. Adding them without checking overlaps can count the same money twice.
Use Open High-Value Cases to Plan Work
Say the closed cases above also include two $2,000 disputes under review. That is $4,000 of open value. It is not a confirmed loss and not a sure recovery. The 26.47% rate says nothing about how those two cases will end.
Check whether each open case still needs a response or is already submitted. For a case that needs action, check the deadline, the evidence and the owner. Deadlines vary by network, so keep the chargeback time limits close. For a submitted case, keep the status visible and do not resubmit weak material.
Recent periods can rise or fall as decisions arrive. That is why a recovery rate can still change. Review the same group of cases again later rather than comparing an old, closed period with a fresh one full of large open cases.
Choose the Action the Records Support
These are paths to investigate, not proven causes. A change in product mix, fewer small disputes or one unusual order can move a value-based rate with no drop in response quality.
Review results after the change with the same scope and enough closed cases. If large losses are rare, report the actual counts and dollars. Do not present a small sample as a trend.
{{cta}}
Ask Which Cases Cost You the Most
The useful question is: which cases account for the dollars we lost, and what can we verify about them? Pair the answer with the win rate, open exposure and one owned action.
Use Chargeflow Insights to see the disputed dollars behind the headline rate. Then connect each finding to case records and your finance review. For the full metric set, start with chargeback analytics.
Frequently Asked Questions
Why can a high chargeback win rate produce low recovery?
A high chargeback win rate can produce low recovery when a merchant wins many small disputes and loses a few large ones. Compare case win rate and value recovery rate on the same eligible closed cases to see the gap.
Is the disputed amount always the full order amount?
No. A chargeback can cover only part of a payment. Use the disputed amount and currency from the source dispute record, and reconcile any related refunds or adjustments separately.
Should we always prioritize the largest chargeback?
Dispute value is one input, not the only one. The response deadline, available evidence, case status and team ownership also matter. A large amount alone does not mean a chargeback is more likely to be won.
Do pending high-value disputes lower the chargeback recovery rate?
No. Pending disputes sit outside the won-plus-eligible-lost denominator until they close. Track their value separately, because later outcomes can move the recovery rate up or down.
Does Chargeflow Insights find the cause of a large chargeback loss?
Chargeflow Insights shows rates and breakdowns that point to a pattern worth checking. Confirm the cause with transaction, support, fulfillment and dispute records before you change any policy.
See the Dollars Behind Your Win Rate
Inspect disputed value, recovery and open exposure together in Chargeflow Insights. Free forever.

Chargebacks?
No longer your problem.
Recover 4x more chargebacks and prevent up to 90% of incoming ones, powered by AI and a global network of 20,000 merchants.